| Remember this plot from the first
page in this section ? Well, Figure 2 shows a computer generated plot that
is somewhat similar: |

Figure 1 - Actual Time Domain
Signal
|
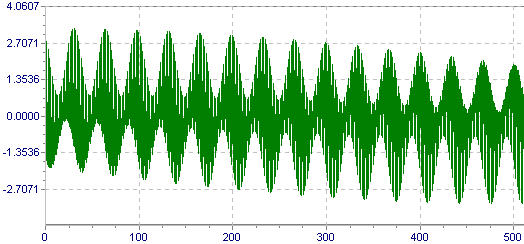 Figure 2 - Computer Generated
Time Domain Signal
Figure 2 - Computer Generated
Time Domain Signal
|
|
| You can see the low frequency (usually
1x rpm) cycle still occurring but this shape looks somewhat like an Angel
Fish. This shape is typical of an amplitude modulation. Let's zoom in on
the computer generated signal to get a clearer picture of what is happening. |

Figure 3
|
| Figure 3 shows only a bit more than
a single one of the low frequency cycles. It is clear that the high frequency
signal (the gear mesh amplitude) is increasing and decreasing in amplitude
at a rate of once per shaft revolution. Figure 4 shows the two signals
involved separated: |

Figure 4
|
| This represents what we were discussing
before - a modulation of gear mesh amplitude once per shaft revolution
due to a gear problem. The amplitude varies significantly at a rate of
once per revolution. How does the FFT handle amplitude modulation ? Figure
5 shows you: |

Figure 5
|
| Figure 5 shows a peak at 1x rpm
and a peak at gear mesh frequency (GMF) with smaller peaks surrounding
it. It you could measure the frequencies involved, you would see that the
smaller peaks are equally spaced around the large peak - the separation
is equal to the frequency of 1x rpm. There may be a series of these peaks
called sidebands around the
gear mesh frequency. This series of peaks are what would mathematically
cause the amplitude to go up and down (modulate) as the peaks go in and
out of phase with one another. The difference between sidebands and other
noise around a peak is the equal spacing (1x rpm in this case). Peaks that
are not equally spaced are most likely not sidebands. |
| Peaks on the higher frequency side
of the large peak will be located at GMF + 1x rpm, GMF + 2x rpm, GMF +
3x rpm, etc. On the low frequency side of GMF, the peaks will be located
at GMF - 1x rpm, GMF - 2x rpm, etc. The spacing of the peaks is the key
indicator in where the problem lies. The spacing at 1x rpm
indicates the gear running at that frequency (speed) is the source of the
problem. |
Although not nearly as common as
harmonics, sidebands are critically important to learn to recognize for
a couple of reasons:
-
Sidebands always indicate a problem
(amplitude modulation is never "normal").
-
Sidebands are only generated by three
types of problems:
-
Gear-related problems
-
Bearing-related problems
-
Electrically-related problems
-
Sidebands can be significant at very
low amplitudes (their mere presence can be significant).
-
Sidebands should be analyzed on a logarithmic
scale (as opposed to a linear amplitude scale) so the low-amplitude peaks
can be detected.
|
|
The Addition
Of Sidebands Is The FFT's Explanation Of The Presence Of Amplitude
Modulation
|